cognitive science
and more
Intro Bio Psy
Advertisement

I have launched a forum (forum.cogsci.nl). I hope that this will be a convenient way to handle support for the various software packages that are available here. Because of the steadily increasing number of comments and questions, mostly related to OpenSesame (which has been downloaded more than 7000 times now), it became a bit difficult for me to keep track of everything with the current commenting system.

The COGSCIdotNL forum

But, of course, the forum is not limited to technical support, and anybody is free to talk about pretty much anything!

Read more »

Skull measuring continued: Latitude, eye size, and cranial capacity

Pearce, E., & Dunbar, R. (2011). Latitudinal variation in light levels drives human visual system size Biology Letters DOI: 10.1098/rsbl.2011.0570

Skull measuring is all the rage these days. A while back I wrote about a study by Lewis and colleagues, in which they showed that the 19th century anthropologist Samuel George Morton was correct in his assertion that cranial capacity differs between racial groups. This was surprising, because Morton's research had previously been dismissed as a prime example of how racist assumptions can bias results. It was believed, in other words, that Morton had tampered with his data to make sure that Caucasians had the largest cranial capacity of all racial groups.

A globe (source: [url=http://commons.wikimedia.org/wiki/File:Globe.jpg]Wikimedia Commons[/url])Lewis and colleagues were quick to distance themselves from Morton's distinctly racist views, and emphasized that differences in cranial capacity do not reflect differences in intelligence, as Morton had believed. But this, of course, begs the question: If not intelligence, what do differences in cranial capacity reflect?

A recent paper by Pearce and Dunbar in Biology Letters sheds new light on this issue. Pearce and Dunbar measured the size of eye sockets and brains in skulls of people from various parts of the world. Unlike Morton, they did not focus on racial groups, but on the latitude of people's habitat (how far up north people lived). Their finding is straightforward: People that live far up north have larger eyes and correspondingly larger brains. Why? Because near the poles the days are shorter and, more generally …

Read more »

Evocogno blog: What Fodor and Piattelli-Palmarini got wrong

Tip: On his brand new 'evocogno' blog, my friend and colleague Richard Godijn writes about Fodor and Piattelli-Palmarini's book "What Darwin got wrong". The title of the book says it all: In it, the authors criticize Darwinism, or at least a straw-man parody of it, in a convoluted and not particularly insightful way. (I haven't actually read the book, but that rarely stops me from passing judgement.)

And Richard is having none of it!A related cover of the New Scientist

Incidentally, there's also a link to the BBC documentary "What Darwin didn't know". For your convenience, here it is (full version, while it's still on YouTube at least):

Read more »

Internet as external memory

Do you remember what it was like before the Internet? If not, just Google “what was it like before the internet?” and you will.

In a recent study in Science, Sparrow and colleagues investigated whether people indeed use the Internet as an external memory store. This idea is not entirely new (in fact, it may be kind of obvious that, in some sense at least, we do), but their experiments are quite nice.

Firefox web browserThe first experiment is most compelling, so I will give you a few details. Participants were asked questions that were either easy or difficult. After a series of questions, all of approximately the same difficulty, participants performed a Stroop-like task. In this task, participants had to name the colors of words. Like this:

Google Nike Yahoo Shell

So that would be “red, green, blue, red”. You get the point. The idea is that we are such overtrained readers that word-meaning is processed before color. If a word is particularly interesting, it will capture attention and interfere strongly with the color naming-task. As a result, the response is delayed for interesting words.

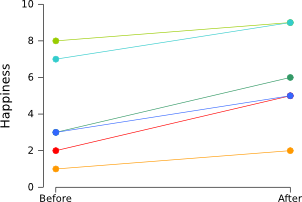
The crucial finding was that people are slower to name the color of computer-related words (such as Google), compared to control words (such as Nike), particularly after a series of difficult questions. The authors concluded from this that when we hear a difficult question, we don't think about the question per se, but about how we are going to find out the answer. Which is typically …

Read more »

An easy way to create graphs with within-subject error bars

Let's consider an experiment in which participants were shown happy pictures (warning: this is a silly experiment, without a proper control condition). Before and after they saw the pictures, they filled in a questionnaire to estimate their mood on a scale from 1 (sad) to 10 (happy). The results of the experiment are shown in the graph below. Each line represents a single participant.


Clearly, people became happier after seeing the happy pictures. This can also be verified easily using a paired samples t-test, which shows that the “before” scores are significantly lower than the “after” scores (p < .005).

However, the graph isn't that nice. We don't want to see individual participants. We'd rather see two average scores ("before" and "after") and a measure of the variability. So what we can do is create a graph with error bars that reflect the 95% confidence interval (i.e., the average of the population is 95% certain to fall within the depicted range):


As you can see, the error bars are very large and show a huge overlap! If there is that much variation, how can it be that the difference between “before” and “after” is so highly significant? The reason is that the we are only interested in whether participants have become happier or not. We are not interested at all in how happy the participants were to begin with. All participants became happier and therefore our t-test showed a significant difference between “before” and “after”. But there is a lot …

Read more »